
Part II · Chapter 13
Analysis Tools
The Analysis Portal
Click Analysis Portal in the toolbar. Each detector in the setup has a row, and each row holds one or more analyses. + Add analysis adds one. For each analysis you set:
- Analysis type, from the list below.
- #Rays, the number of rays traced from each light source.
- #Pxls X / Y, the resolution of the result.
- Display, for example gray scale.
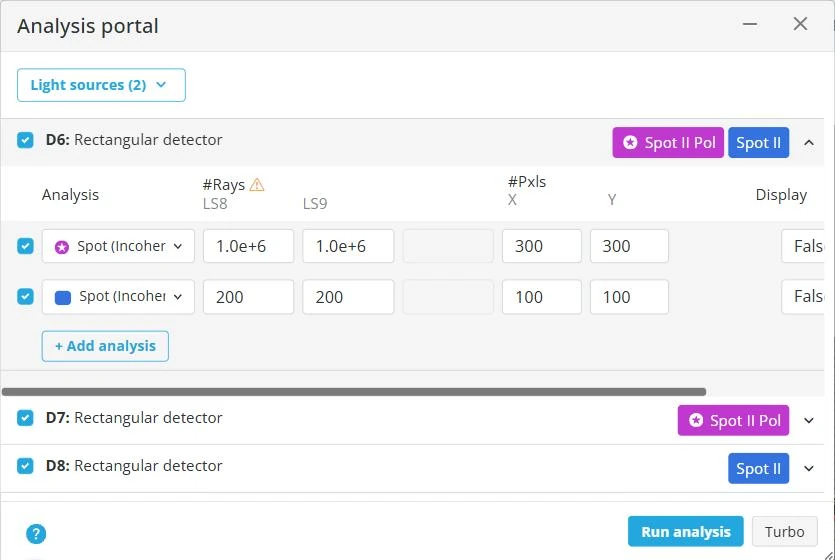
Run analysis computes every analysis that is checked. The Light sources selector at the top chooses which sources take part.
Fast and advanced analyses
| Fast | Advanced | |
|---|---|---|
| Maximum resolution | 100 × 100 | About 20 million pixels in total |
| Maximum rays per light source | 200 | Unlimited |
| Spot (incoherent irradiance) | Yes | Yes |
| Coherent irradiance, coherent phase, PSF, MTF, wavefront | No | Yes |
The default resolution is 100 × 100. Raising a fast analysis above it is a Professional-tier feature.
Analysis types
Incoherent irradiance
- Spot (Incoherent Irradiance), the irradiance map.
- Spot (Incoherent Irradiance) Polarized, the same, per polarization component.
Coherent irradiance and phase, each computed with one of three propagation methods, Huygens, Fresnel or Fresnel Far, which trade accuracy for speed:
- Spot (Coherent Irradiance) and Coherent Phase, with a Polarized and a Polarized Raw variant.
A phase analysis needs a polarization component, X, Y or Z; None is disabled for it.
Image quality
- Huygens PSF and Fresnel PSF (Convolution), the point spread function.
- Huygens MTF and Fresnel MTF (Convolution), the modulation transfer function.
- Huygens Wavefront and Fresnel Wavefront (Convolution), the wavefront error.
Other
- Spectral Collection Analysis
- Mapping Image
Diffraction settings
The coherent analyses depend on a resolution set per surface. The Diffraction Settings panel lists the surfaces on the beam path; select one to set its resolution. Locking a surface keeps its resolution fixed while you change others.
Viewing several results
Each result opens in its own floating window. Drag a window aside by its title bar, then open the next result to see them side by side.
Reading a result
A result window shows:
- The irradiance or phase map. Click a point to read its pixel and coordinate values.
- X and Y cross-section charts, with fields for the row and column, in pixels or mm. Right-click a point on the map to place the cross-sections through it.
- The polarization component: None, X, Y or Z.
- The light source filter: Total, per light source or per coherence group.
- The resolution, the physical size in mm, the total hits, the total power and the date of the run.
For multi-wavelength results, the multi-channel view shows each color channel with its own histogram and slider.
The Poincaré sphere view plots a ray's polarization state on the sphere.
The extended view
Click into a result to open its extended view, with a toolbar for:
- Display type: False Color, Gray Scale, Spectral View, User-defined Colors (Professional-tier), XY Cross Section, Encircled Energy, and single-axis X and Y cross-sections.
- Zoom in, zoom out and reset zoom.
- A wavelength filter, to show all wavelengths or selected ones.
- A linear / logarithmic scale switch.
- Download as PNG or JPEG, as a full-size image with the raw pixel data, or as XLSX with the full data and the detector settings.
Imaging System
The Imaging System tool computes pupils, focal length and magnification for a group of parts. It has its own section.


