
Part I · Chapter 06
Running a Simulation
The run controls sit at the right end of the toolbar: the Interactive checkbox, the RUN button, the simulation-mode dropdown and the Sources dropdown.

A run needs at least one light source in the setup.
The two simulation modes
- Fast Rays (Beta) traces a small number of rays and returns quickly. Use it while building and adjusting the setup.
- Propagation Simulation traces the full ray count with full accuracy. Use it for analyses, measurements and final checks.
Interactive runs
With Interactive checked, the trace reruns by itself whenever you move or add a part. This suits Fast Rays. Unchecked, nothing runs until you click RUN, which is the better choice for Propagation Simulation.
Sources
The Sources dropdown selects which light sources take part in the run.
Ray colors
Ray Colors in the toolbar (also View → Change ray color palette) offers five modes:
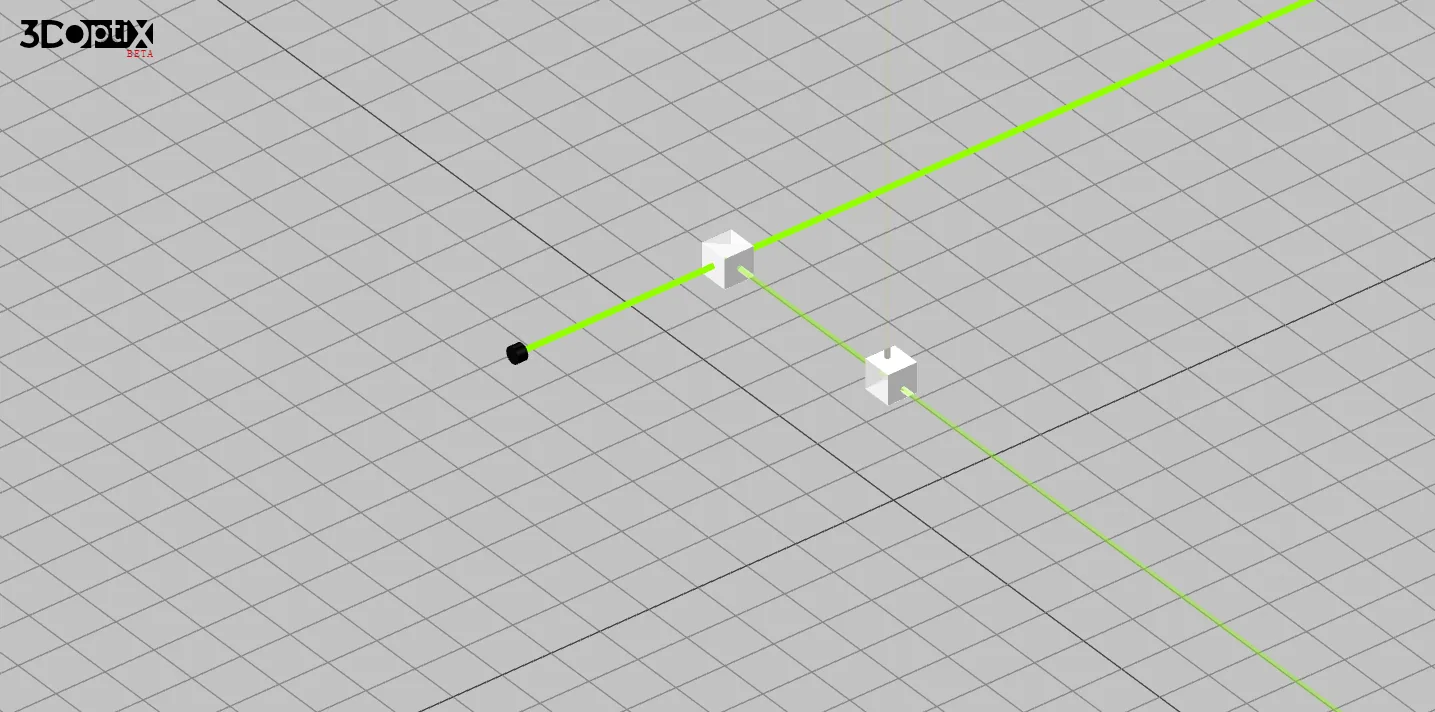
- Spectral ray colors: by wavelength; weaker rays are drawn fainter.
- Spectral log rays colors: by wavelength, with intensity on a logarithmic scale so that faint rays stay visible.
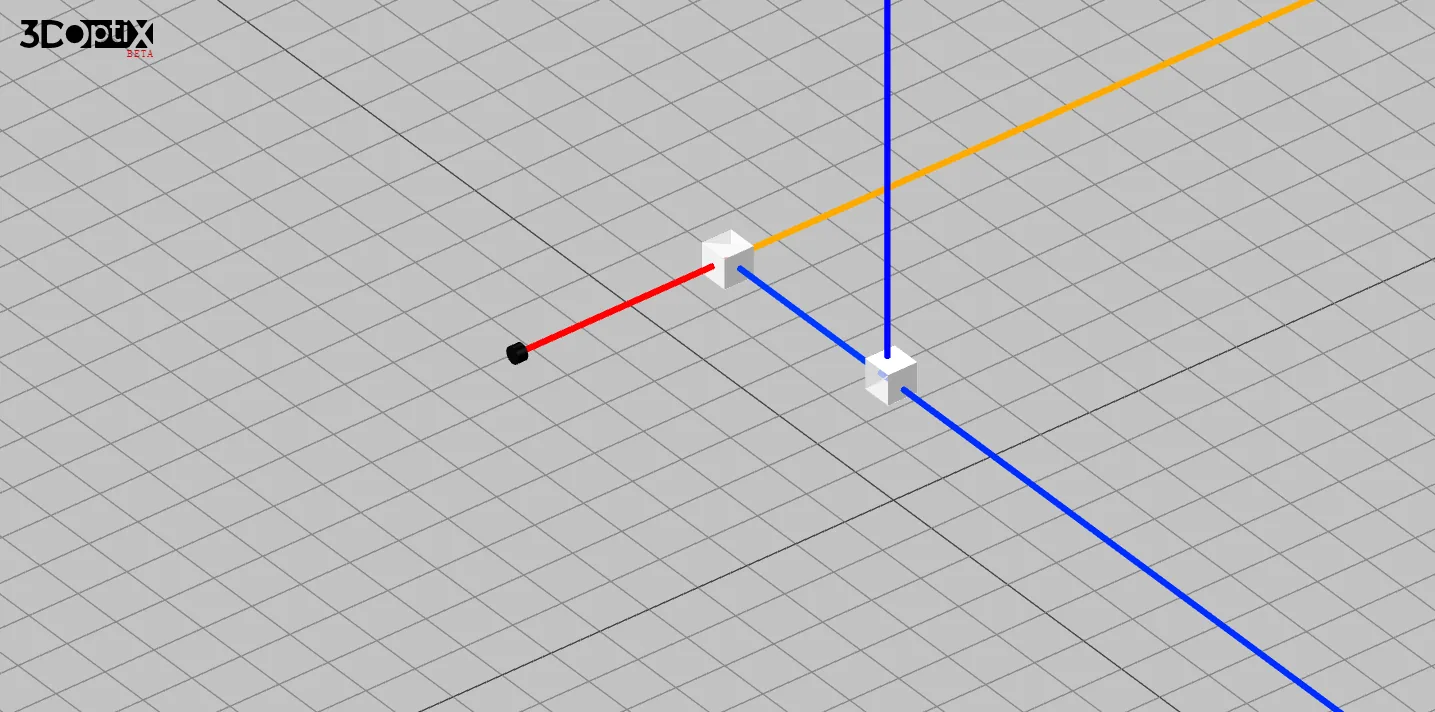
- Intensity based ray colors: a false-color scale, red for the strongest rays and blue for the weakest.
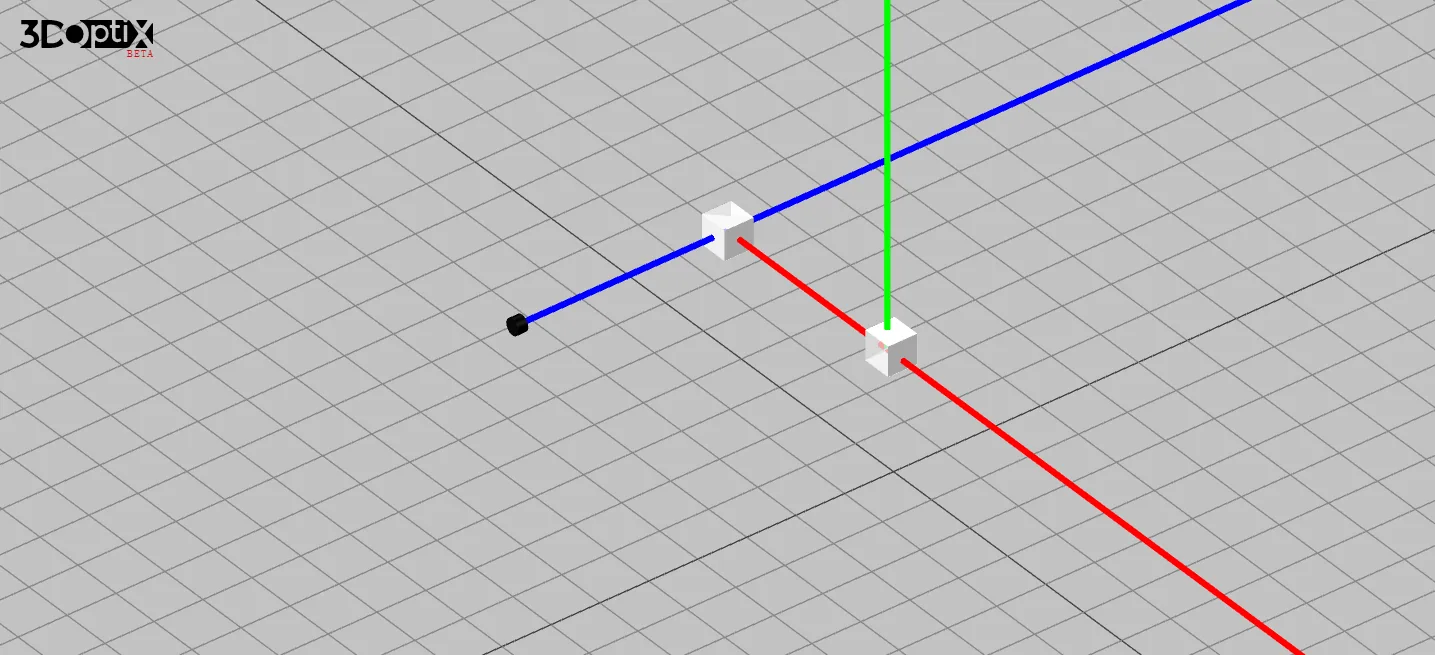
- Directional ray colors: by direction of travel.
- User-defined colors: your own mapping (Professional-tier).
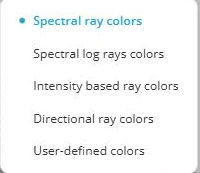
Figure 6.3 shows one setup, a single-wavelength source on two 70:30 beam splitters, in three of the modes.
Analysis Portal
The Analysis Portal button opens the panel where you set up and view analyses of the traced rays. It is described in Analysis Tools.


