Part I · Chapter 02
Interface Overview
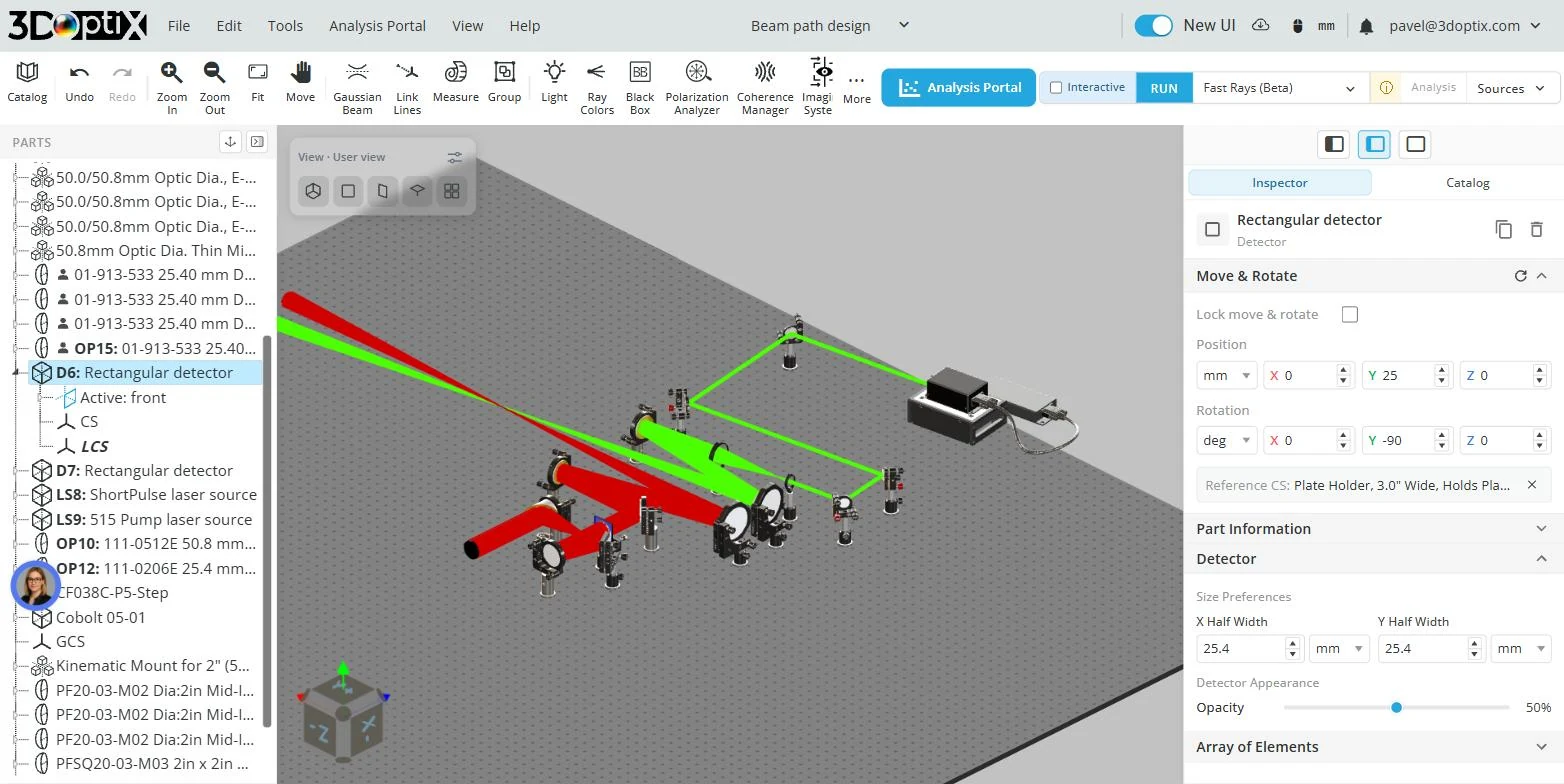
With a setup open, the screen has five areas:
- Menu bar: the File, Edit, Tools, Analysis Portal, View and Help menus, the setup name, your account name and the notification bell. Help → User guide opens this manual.
- Header toolbar, under the menu bar: Catalog, Undo, Redo, Zoom In, Zoom Out, Fit, Move, Gaussian Beam, Link Lines, Measure, Group, Light, Ray Colors, Black Box, Polarization Analyzer, Coherence Manager, Imaging System and More (which holds Visibility). At the right end sit the run controls: Analysis Portal, Interactive, RUN, the simulation mode and Sources.
- PARTS tree, on the left: every part in the setup with its coordinate systems and surfaces. A dock icon in the tree's header moves the tree to the bottom of the Inspector and back.
- 3D viewport, in the center, with the View gizmo in its top-left corner.
- Inspector, on the right, with two tabs: Inspector shows the settings of the selected part, starting with Move & Rotate; Catalog is where you add parts.

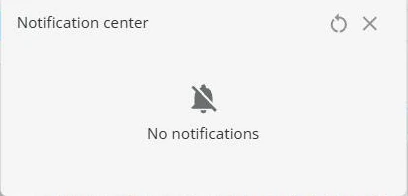
The notification bell
The bell next to your account name opens the notification center, a list of messages from the tool. Short messages also appear briefly as a pop-up at the bottom of the screen; longer-running operations report their progress here. Open the bell to read anything you missed.