- 2x Perfect Mirrors
- 2x Perfect Beamsplitters
- Detector side beamsplitter tilted 0.05 degrees
- User-Defined Object: Glass Slide
- Light Source
- Plane Wave
- Circular, 2.5 mm radius
- 633 nm wavelength
- Power, 1 W
- Linearly polarized
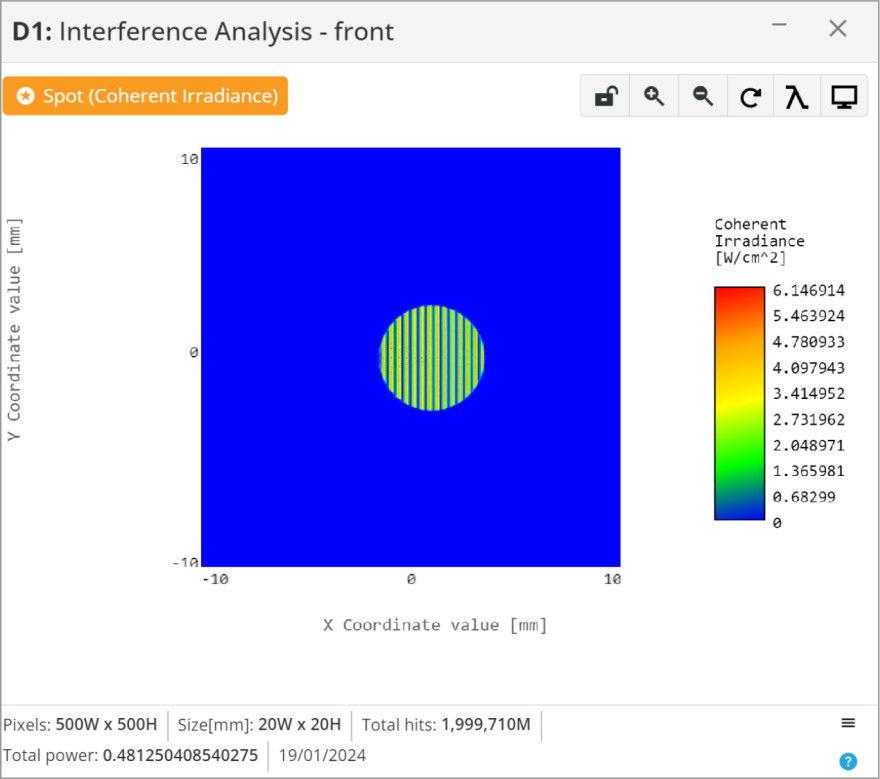
- Detector: Path I
- Spot: Coherent Irradiance
- Analysis Rays: 1 million
- 500×500 pixels
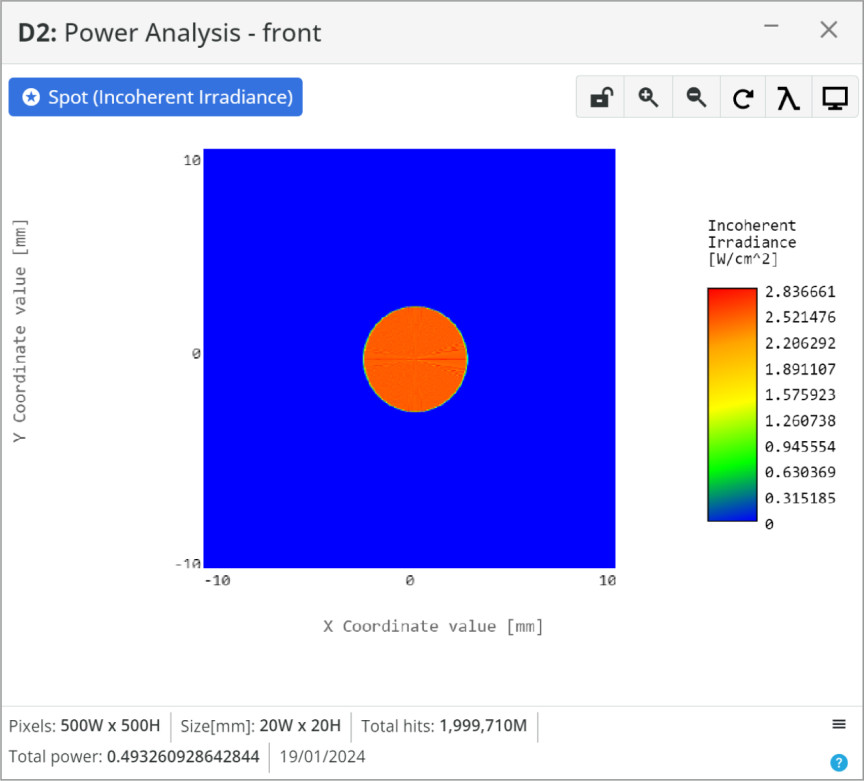
- Detector: Path II
- Spot: Incoherent Irradiance
- Analysis Rays: 1 million
- 500×500 pixels
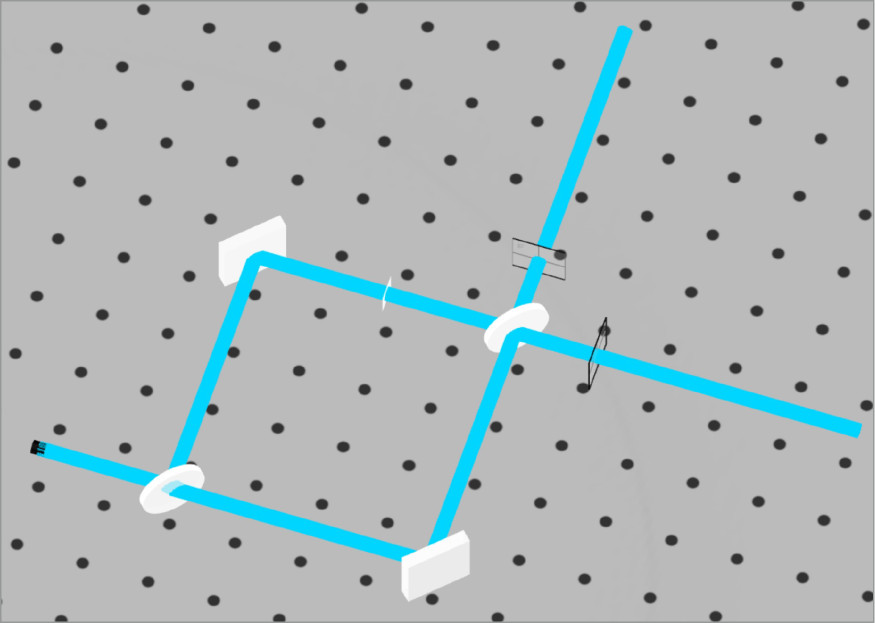
As individual rays (geometric optics) are used to determine the interference pattern by amplitude and phase at the detector, some concepts of waves (physical optics) cannot be simulated. However, in this type of interferometer one important concept of phase shifts for waves should be understood to fully appreciate the system.
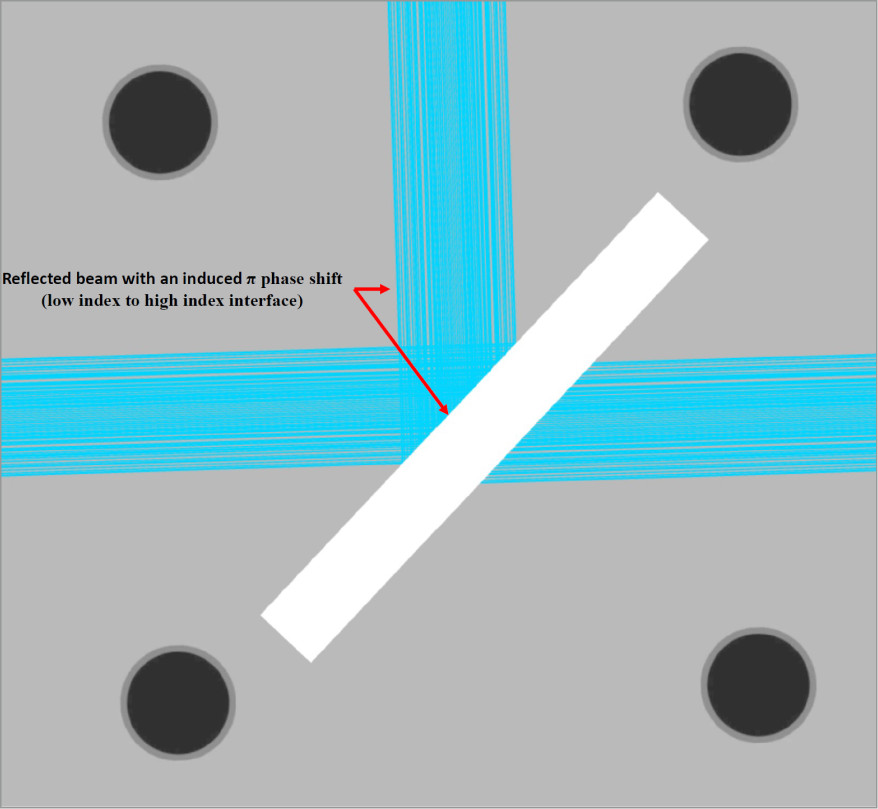
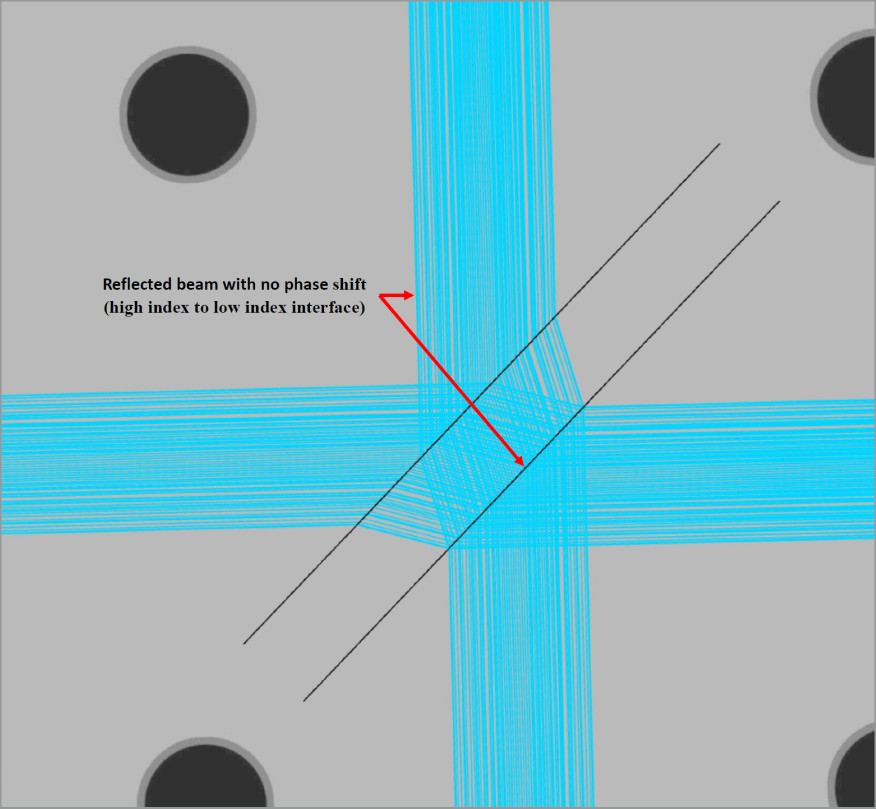
We will analyze the phase shift generated by reflections (relevant to waves) in the Mach-Zehnder interferometer configuration. These phase shifts, adding π phase for each reflection, will occur when the light is incident on a surface of higher refractive index, e.g. from air to a reflective surface. Note that reflections occurring at glass-reflective interfaces (high to low index) do not generate a phase shift.
Assessing the two independent paths after the first beamsplitter generates the following reflections that produce \pi phase shifts.
Reflected path (red): Undergoes two reflections resulting in a total phase contribution of 2\pi at both detectors.
Transmitted path (blue): Undergoes two reflections upon reaching detector Path I and one reflection upon reaching detector Path II.
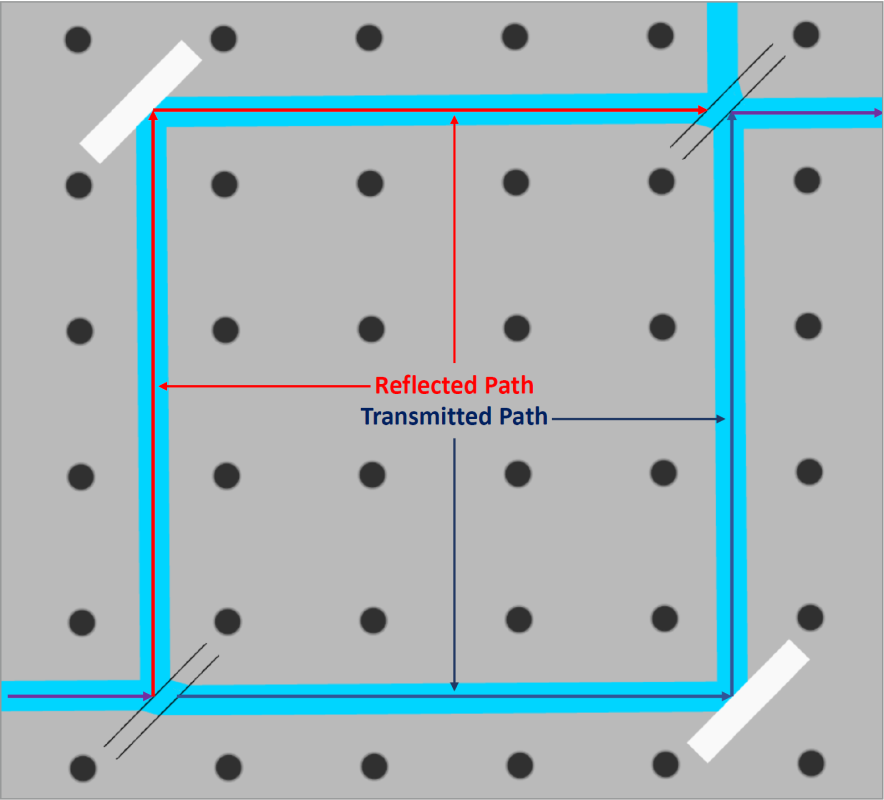
In a perfect setup with no errors in positioning of the mirrors or beam splitters this would create complete constructive interference on Path I detector and destructive interference on Path II detector, meaning no power would be present there. However, this state is difficult to realize, so there will be light reaching both detectors. In our analysis small shifts in the optical path length (OPL) of one beam path will produce interference fringes. These \pi shifts are only described by the wave nature of light.
The Mach-Zehnder interferometer has two correlated paths for the light to travel which means moving one arm (any combination of mirror and beamsplitter) extends the OPL of both beams equally. To vary the OPL of just one path a glass slide of varying thickness is inserted in the reflected beam path to change the phase. This way phase analysis can be conducted by observing the fringes at Path I detector.
Let’s first look at the interference pattern at the output. We will place two detectors. Path I detector to view COHERENT IRRADIANCE and Path II for INCOHERENT IRRADIANCE. What we expect is the power to be evenly distributed between coherent and incoherent power, but the peak COHERENT IRRADIANCE should be twice that of the incoherent irradiance.
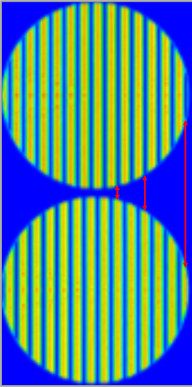
The OPL can now be varied by changing the thickness of the glass slide and therefore changing the interference pattern. If the glass thickness is equal to d = \frac{\pi}{\frac{2\pi}{\lambda}(n-1)} , then the constructive and destructive interference points will line up opposite the pattern when the glass slide is not inserted. The images to the right show the interference pattern without the glass slide (top) and with the glass slide inserted with a thickness of 692.56 nm (bottom). As can be seen by the arrows the constructive and destructive interference pattern lines up anti-symmetrically.
The pattern is difficult to recognize as the fringe frequency is high and fringe widths are small. To increase the clarity of this concept, we can change the tilt of the second beamsplitter positioned near the detectors to decrease the fringe frequency.
This will allow a clearer view of the fringe locations for each detector image. Originally, the second beamsplitter, on the detector side, was tilted 0.05 degrees to observe the fringes, but the fringe frequency is very high at this tilt angle. The beamsplitter tilt will be reduced to 0.007 degrees to reduce fringe frequency and increase fringe width.
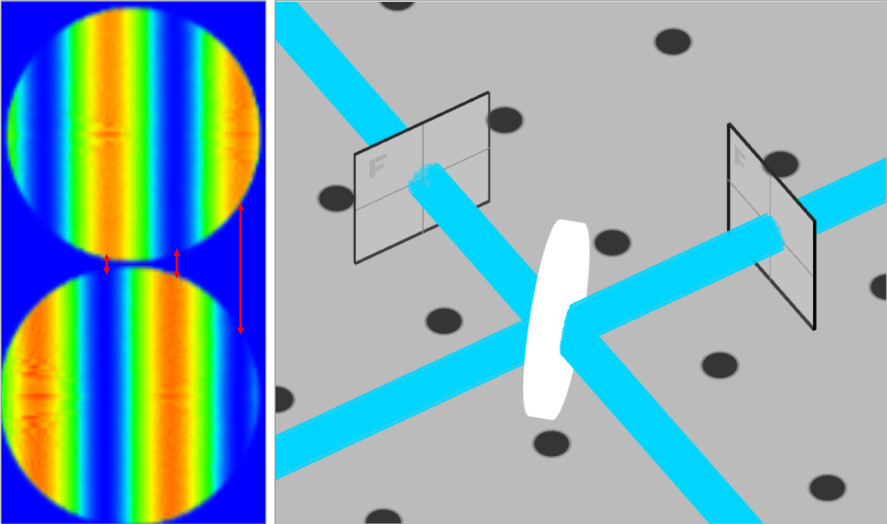
We will increase the thickness of the glass slide by 100 nm to show the change in the fringe pattern at Path I detector.
The images below, from left to right, have the following glass thicknesses with the baseline “no glass” image above each one:
- 100 nm
- 200 nm
- 300 nm
- 400 nm
- 500 nm
- 600 nm
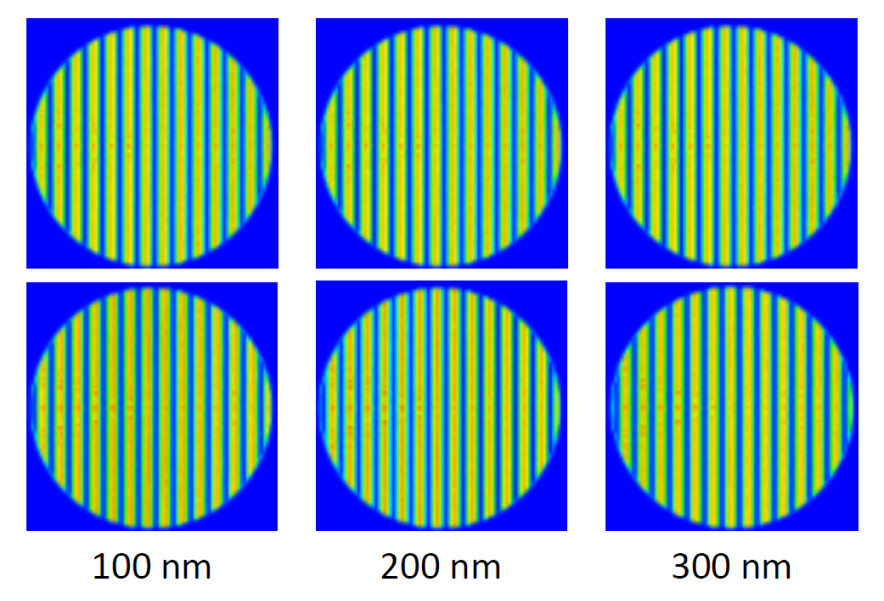
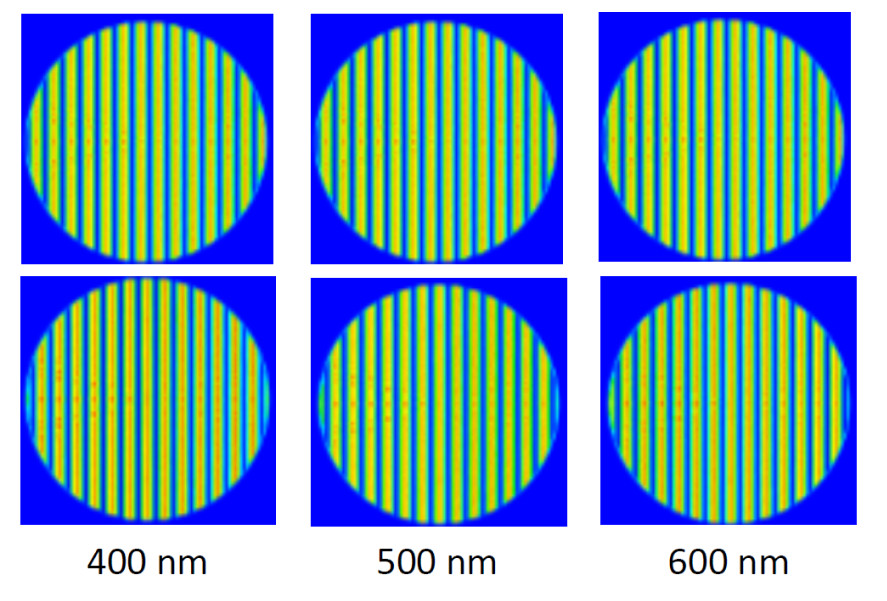
The images show that the fringe pattern shifts to the right as the thickness of the glass slide is increased, which increases the OPL of the reflected path.
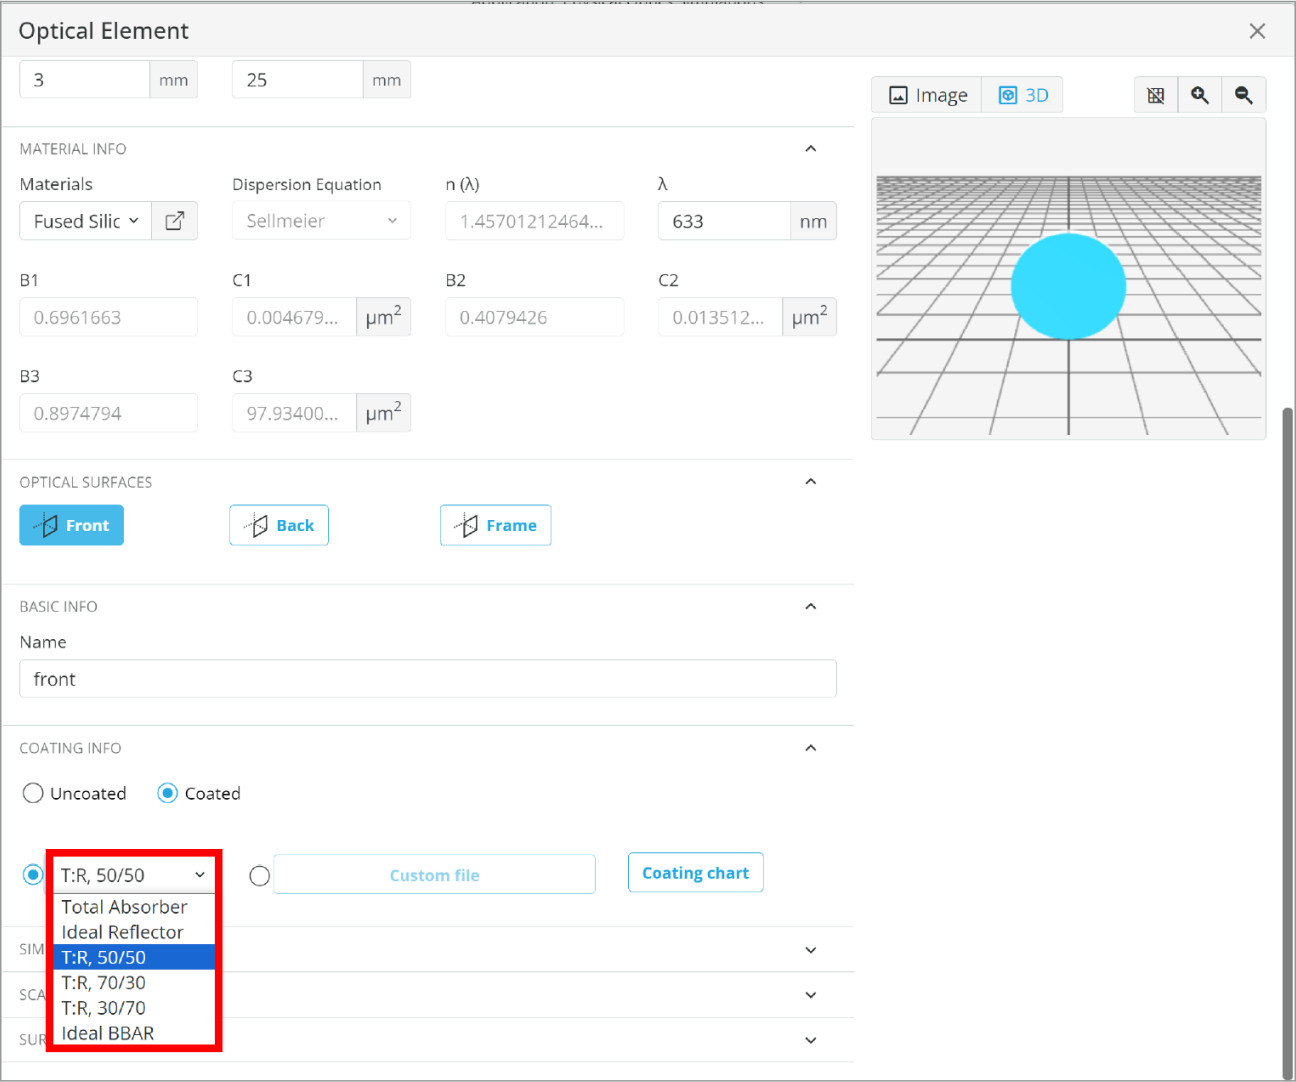
For applications that use interferometry for sample measurements the transmission can be detrimental to the interference pattern. A method to correct for this are beamsplitter coatings that do not equally separate the light. More light should be incident on the sample due to losses and a higher split ratio, such as 70:30 R:T, can be used to ensure maximum fringe contrast. We can look for a different ideal beamsplitter coating in the dropdown for the beamsplitter we have in the 3D viewer, or choose a manufacturer’s beamsplitter with the appropriate coating.
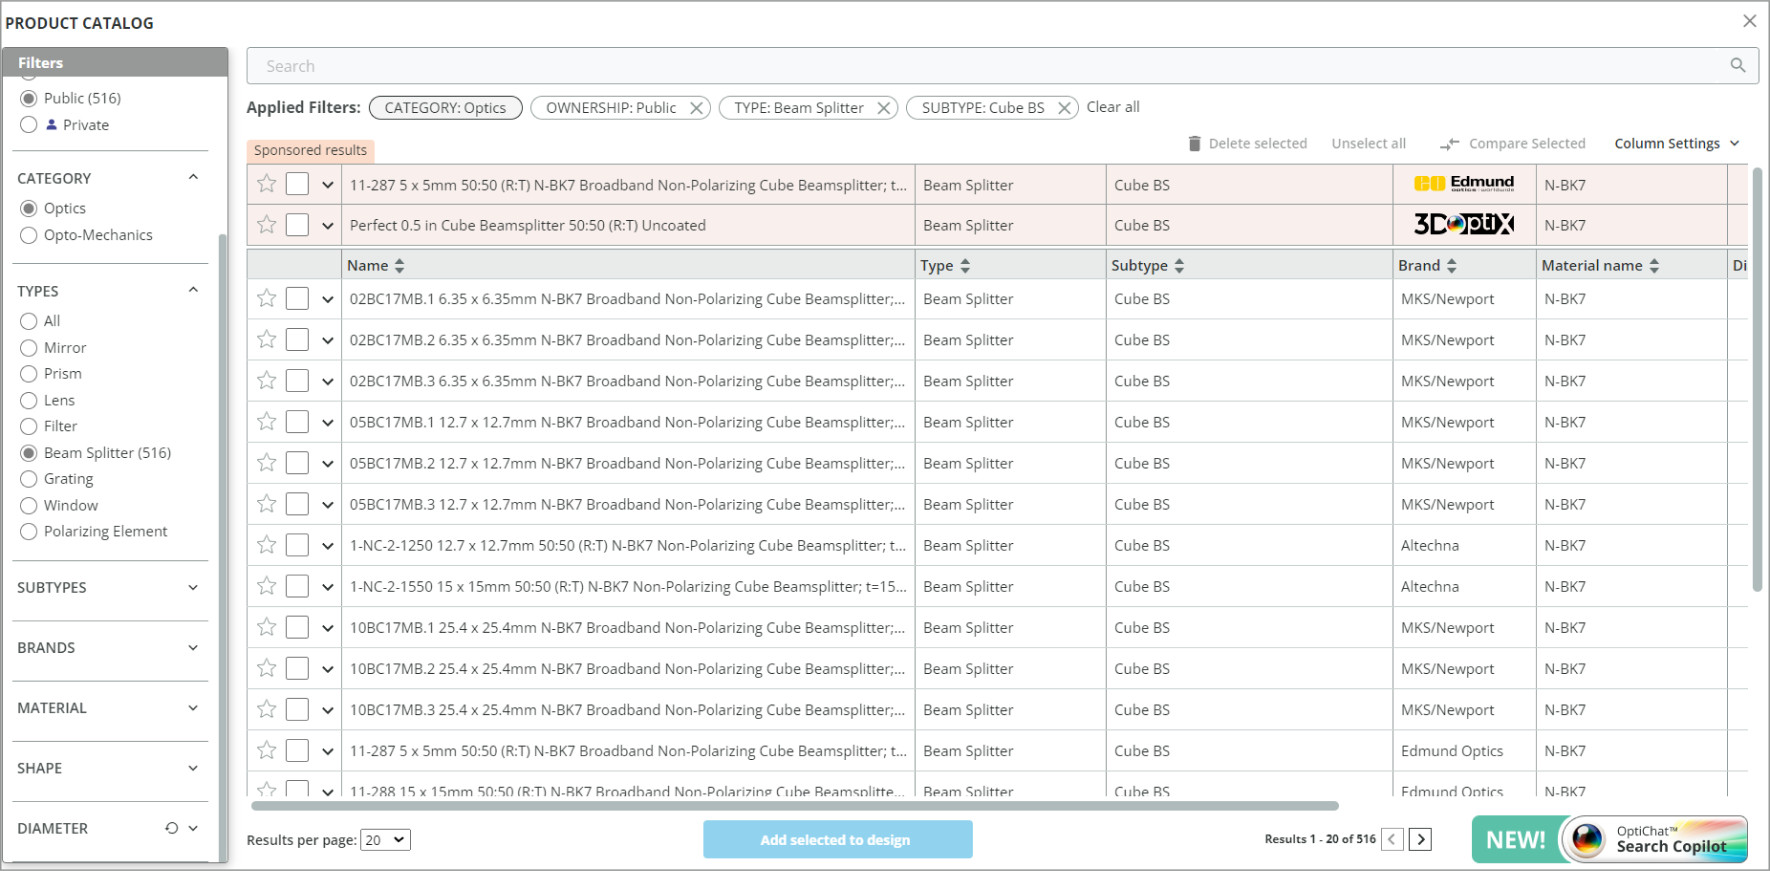
An appropriate beamsplitter with coating can be found either in the USER-DEFINED OBJECT or the PRODUCT CATALOG shown in the image above. If the absorption of the sample is known then this simplifies the selection process as the split ratio can easily be calculated for optimal design.
The Mach-Zehnder interferometer is a great tool to show how geometric optics can simulate the wave properties of interference light phenomena by physical optics. The results show that interference patterns can be realized using this method and relevant information can be obtained.


