Home

Modeling a Spectrometer

Modeling a Spectrometer

Spectrometers are used to analyze the spectral quantity of light from either a light source or sample. By measuring the intensity of light as a function of its wavelength, they provide insights into the composition, structure, and properties of materials. From simple handheld devices to advanced laboratory-grade setups, spectrometers are employed in various fields such as chemistry, physics, astronomy, and environmental science. They play a crucial role in identifying substances, determining concentrations, and studying molecular interactions through techniques like absorption, transmission, and emission.
In the 3DOptix cloud-based simulation tool, spectrometers can be modeled to determine component effects and system performance by measuring the spectral output quality. We will look at a Czerny-Turner spectrometer to show how to model these optical devices.
Our optical system will consist of a Czerny-Turner spectrometer with the following components:
  1. Eskma Optics 110-0219E, bi-convex
  2. User Defined Metallic Mirror, concave, 50mm Dia., 100 mm EFL, ideal reflector coating
  3. Newport 33009FL01-060R, reflective grating, 1200 g/mm
  4. User Defined Metallic Mirror, concave, 50mm Dia., 100 mm EFL, ideal reflector coating
  5. Slits: 0.5mm, 1mm, 3mm, and 5mm
  6. Light Source: Broadband
    • Plane Wave
    • Wavelength – Top Hat Distribution
      • 300-500 nm range
      • 10 nm step size
    • Power, 1 W
    • Unpolarized
  7. Light Source: Alignment
    • Spot: Plane Wave
  8. Detector: Spectral Analysis
    • Spot: Incoherent Irradiance
    • Analysis Rays: 1 million
    • 200×200 pixels
You can see the image of our optical system below. The 3DOptix simulation file can be downloaded to see additional information about the optical system such as component spacing and analysis detectors.

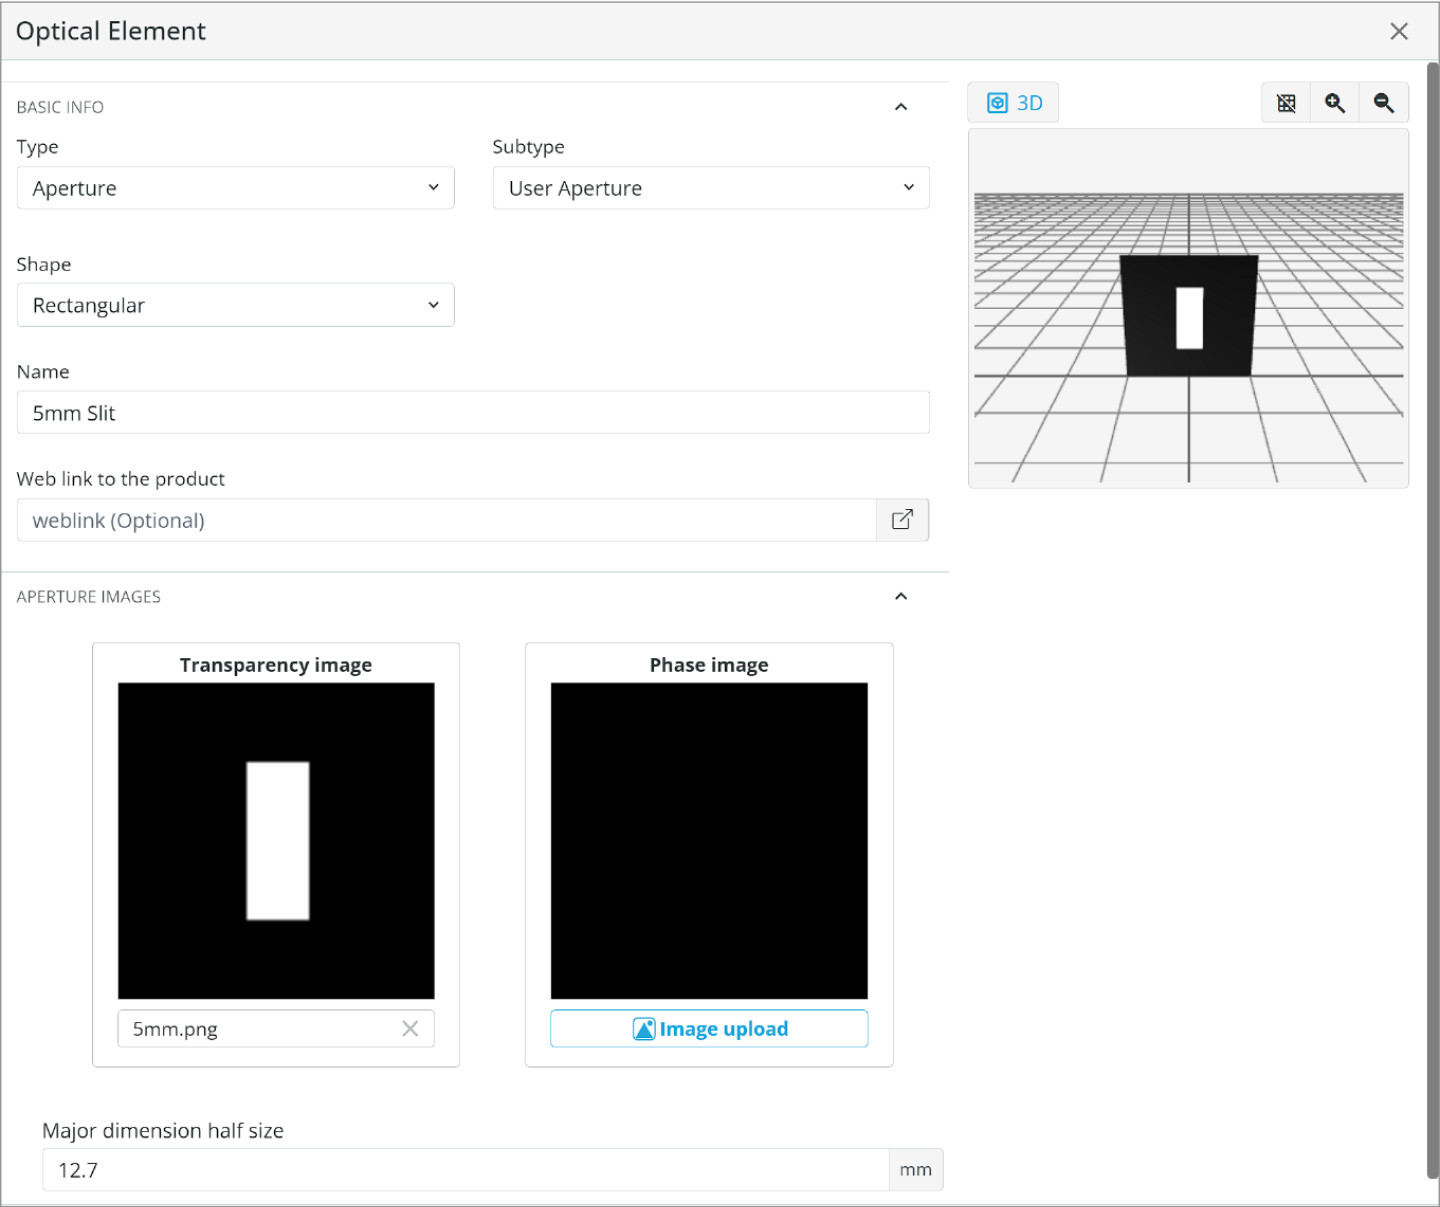
The first step is to create the necessary slits for the system. We will create them in Microsoft PowerPoint for this example, but they can be made in any document program that can specify object dimensions. Of course, we can also make the slits in CAD software and upload them as CAD objects using the IMPORT CAD feature.

Create a square in PowerPoint with the dimensions of 25.4×25.4 mm (1”x1”) and filled with black. Then create a rectangle that is slightly smaller than 25.4 mm and white filled and place it centered in the square. Save the image as a .png in an image program. This is now our slit that we will import into 3DOptix.
We will create four slits to examine differences in resolution and sensitivity across various dimensions.
Importing apertures into 3DOptix is very simple. We will select ADD USER-DEFINED OBJECT in the 3D Layout and upload each slit individually with MAJOR DIMENSION HALF SIZE of 12.7 mm. This will import the slit exactly with the dimensions we specified in PowerPoint.

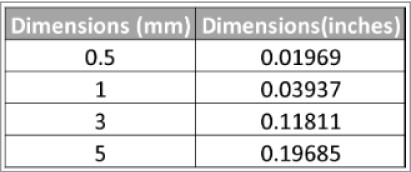
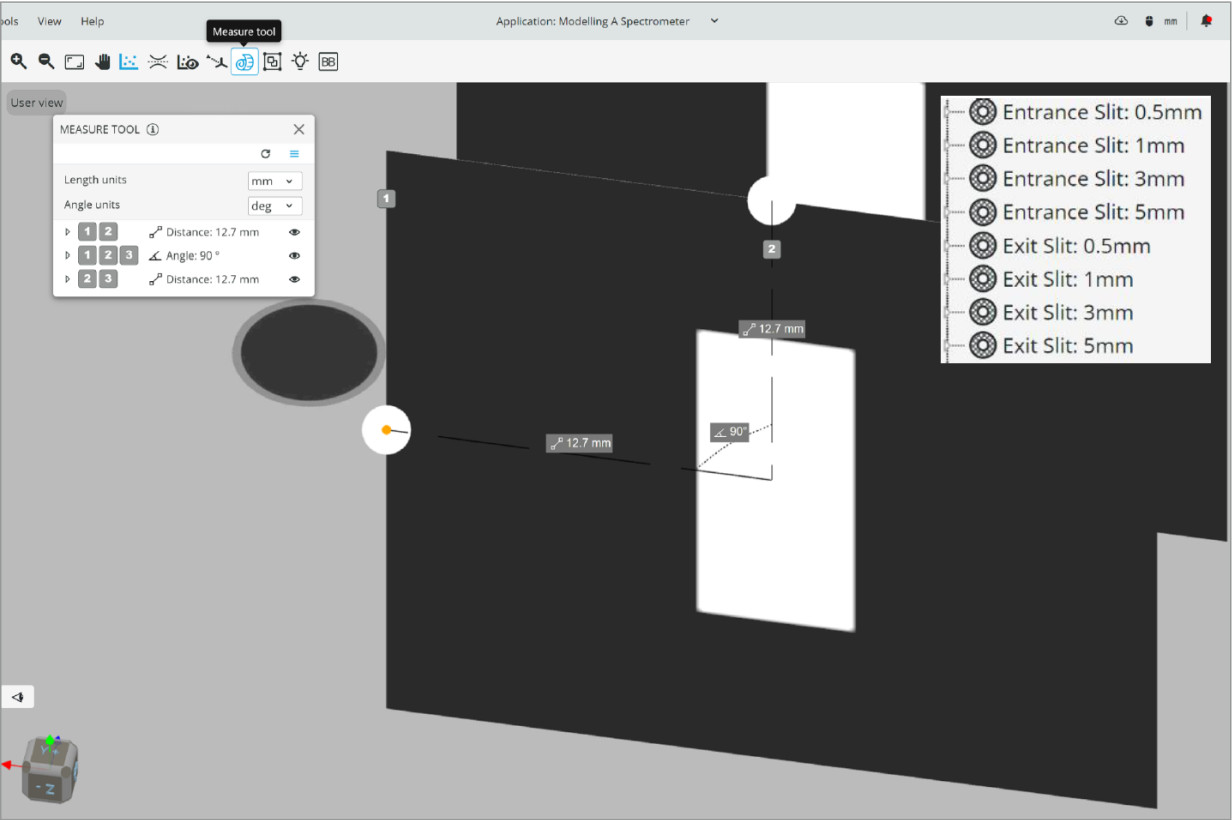
Let’s measure one of the apertures to make sure the import was done correctly. We’ll go to the top bar and select the MEASURE TOOL. We will then click on the center of the slit and both edges.

The measurement tool shows that the aperture was imported successfully with the correct dimensions. This is an important step to ensure that user or import errors do not occur.

Finally, we will duplicate the four slits and assign names to each pair, designating them as entrance and exit slits, along with specifying their respective sizes.
The positioning of the mirrors and grating can be done visually for a quick set up and later optimized by analysis. The lens for focusing the light source through the slit is placed at its focal length from the slit to couple as much light as possible into the spectrometer.

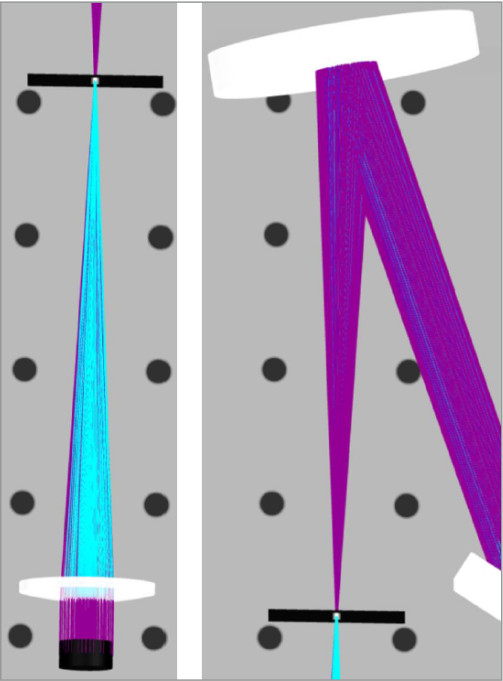
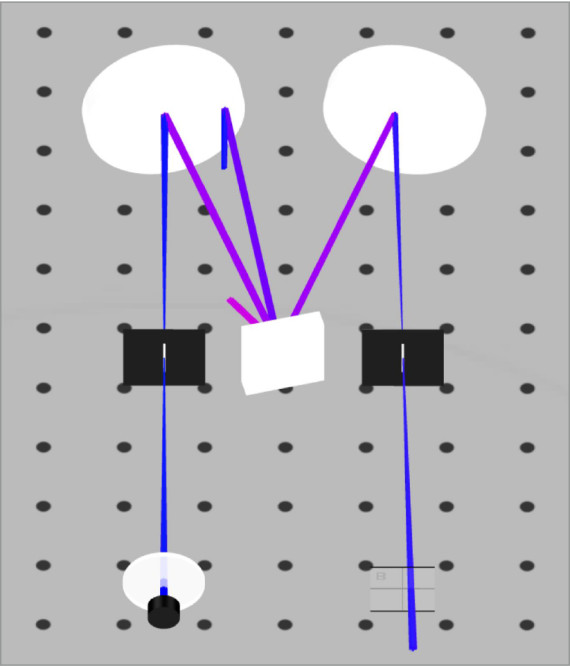
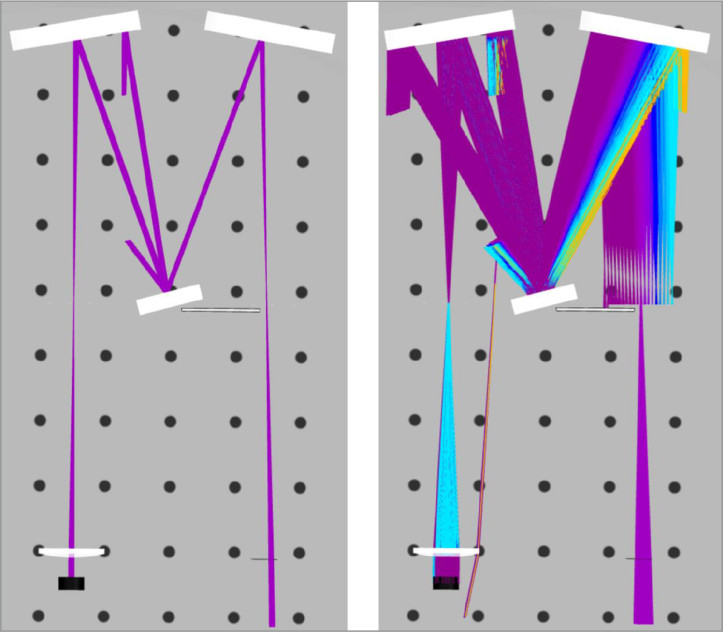
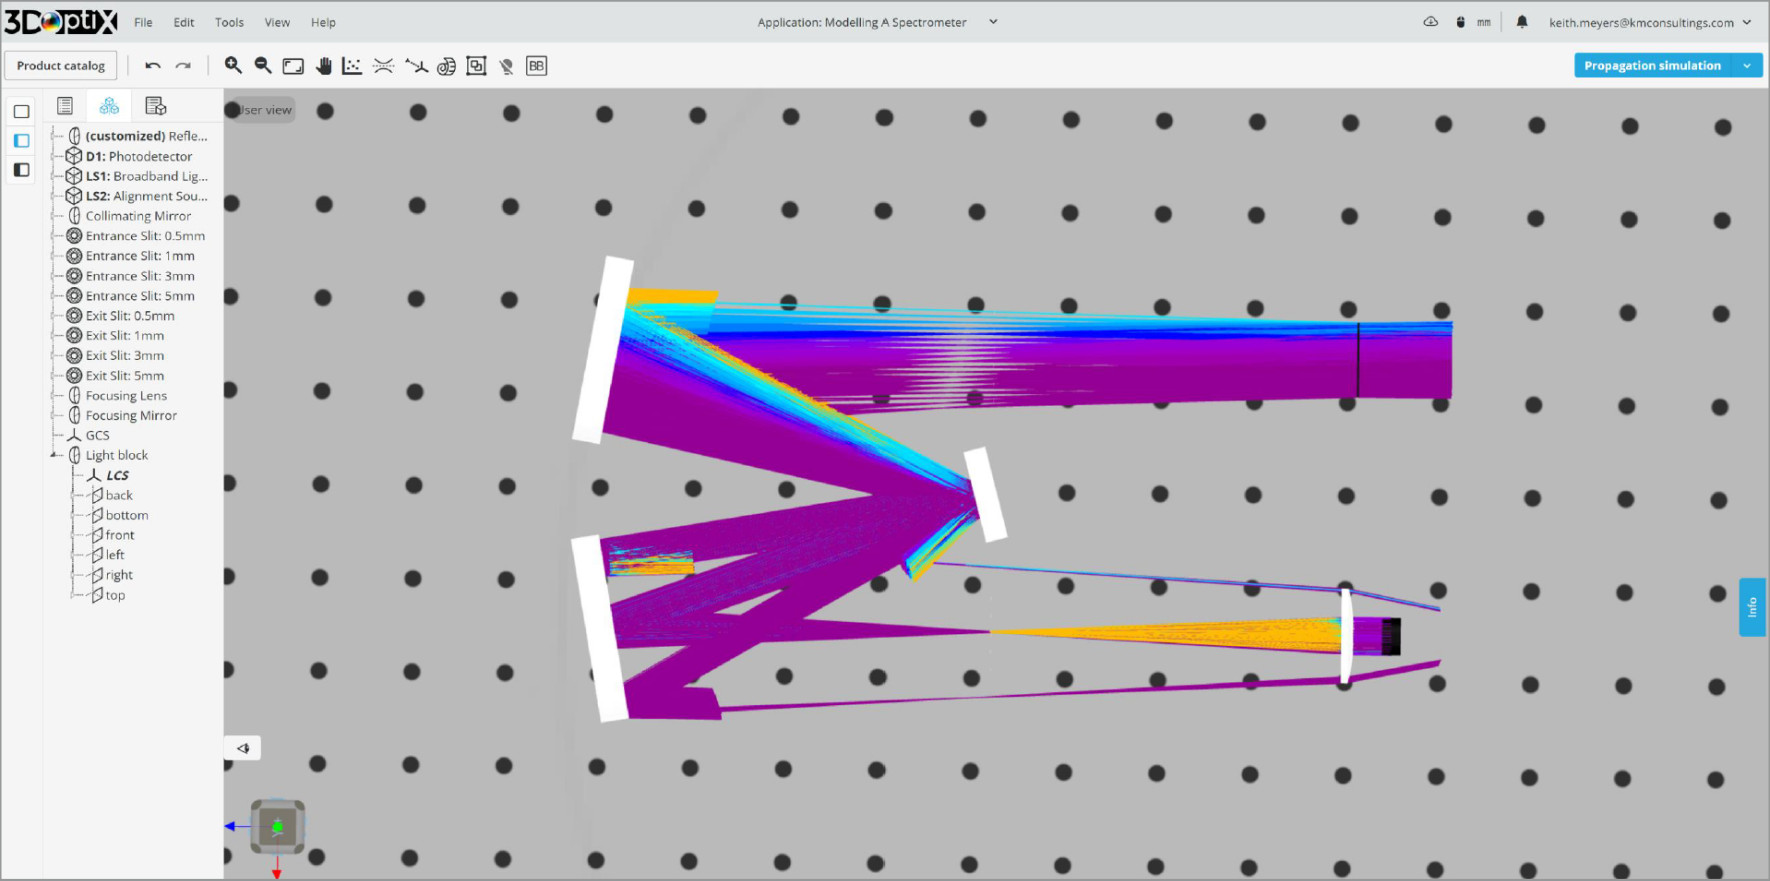
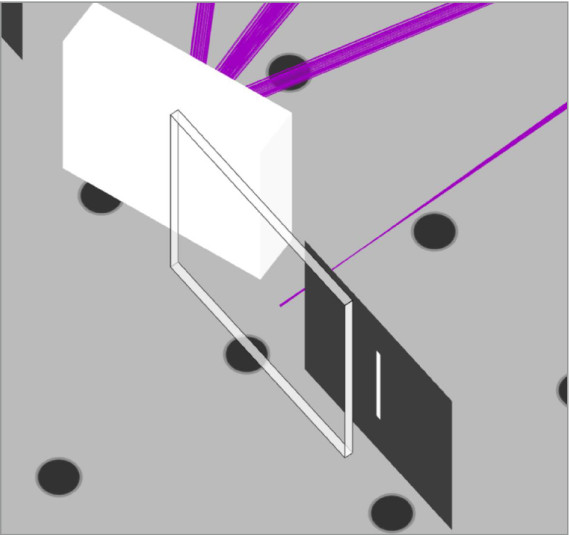
Then the concave collimating mirror on the other side of the slit is also placed at its focal length away from the slit. The mirror is then tilted to direct the light source towards the reflective grating. Since the collimating mirror is a tilted spherical mirror, the optimal position will not be exactly its focal length from the slit. The tilt angle of the mirror is minimized to reduce aberrations.

The grating is placed so that the collimated light from the first mirror is incident on its center, and then tilted to redirect higher diffracted orders of light towards the focusing mirror; mirror 2. The zeroth order diffraction carries all the wavelengths and is not useful to analyze.

The second mirror is then positioned in line with the first mirror horizontally and shifted until the diffracted order of interest is incident on the exit slit. The exit slit is vertically aligned with mirror 2 and horizontally aligned with the entrance slit. The detector is placed horizontally across from the focusing lens and then vertically in line with Mirror 2 and the exit slit.

An easier way to visualize this is with the alignment light source we created initially. Placing it coincident with the broadband light source and then tilting the grating and mirrors until the first diffracted order is aligned with mirror 2, exit slit, and the detector gives us a good starting point.

Now that the spectrometer is set up, we can now analyze the system for sensitivity and resolution.

The resolution of a spectrometer is often determined, in part, by the width of the entrance and exit slits. A narrower slit provides better resolution, as it allows less light of various wavelengths to pass through. However, this also means that less light reaches the detector, reducing sensitivity.

Another factor influencing resolution is the groove density of the grating. Higher groove densities can provide better spectral resolution, but they also disperse the light over a broader area, potentially reducing the amount of light collected by the detector and possible overlapping of orders.

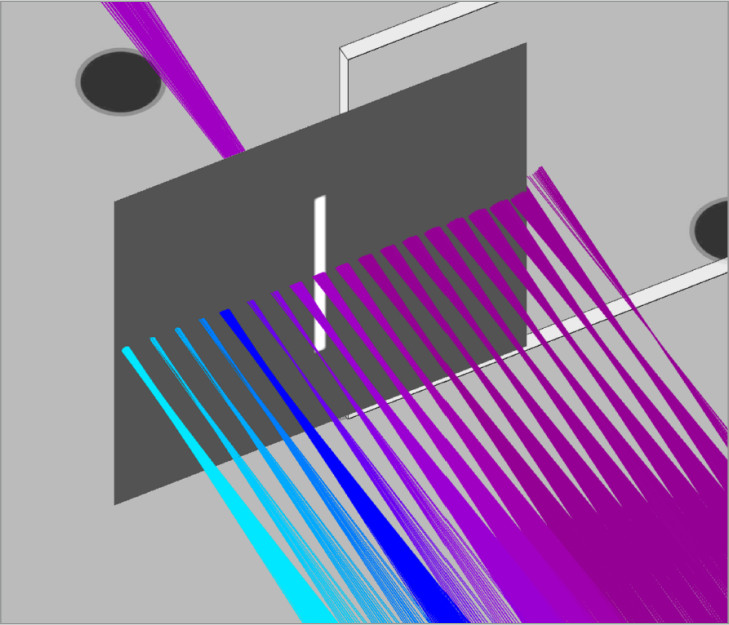
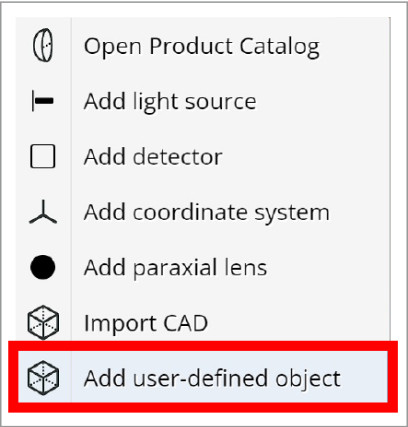
One final addition to the optical system will be a light block to fill the gap between the exit aperture and the grating. We will use the ADD USER-DEFINED OBJECT again to place a flat rectangular window with the total absorber coating to the front. This will stop any stray light from reaching the detector.

Let’s now insert the 5mm slit at both ends and analyze the throughput of the system. The alignment light source will be used to align the system to 400nm in the same manner as used above. Then we will turn off the alignment source and turn on the broadband source. The wavelength we want to pass through to our detector is 400nm and all other wavelengths are undesired.
We can sort our detectors’ visual output by wavelength allowing us to determine which makes it through the slit. From the detector images above, this slit is too large and lets through ~30 nm of spectral bandwidth to the detector.

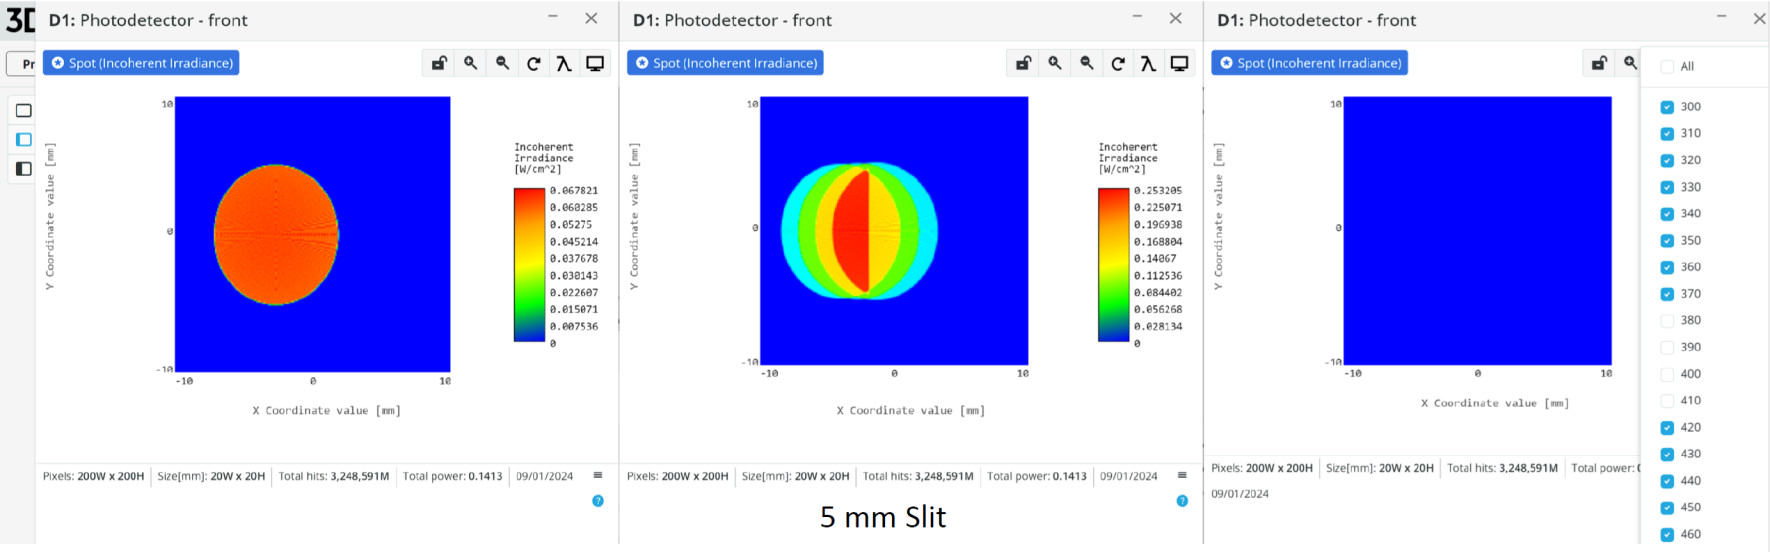
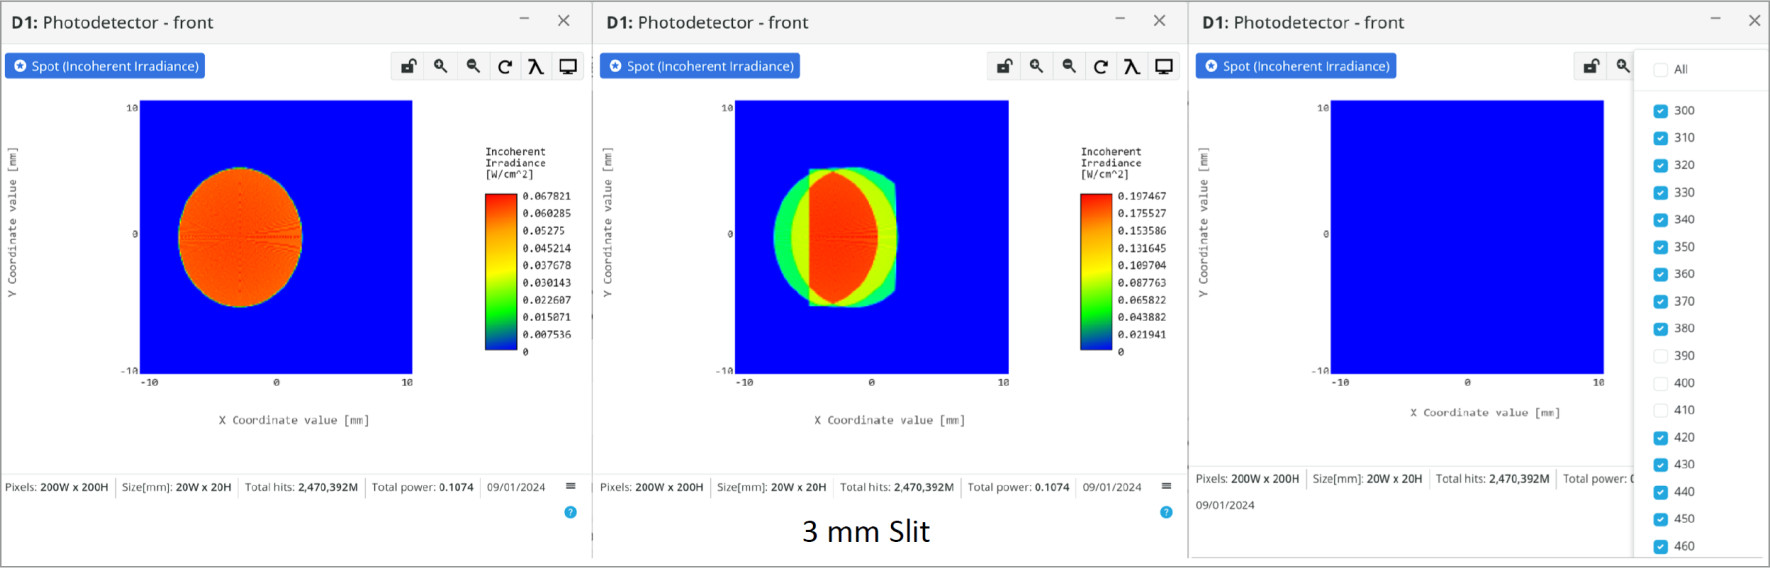
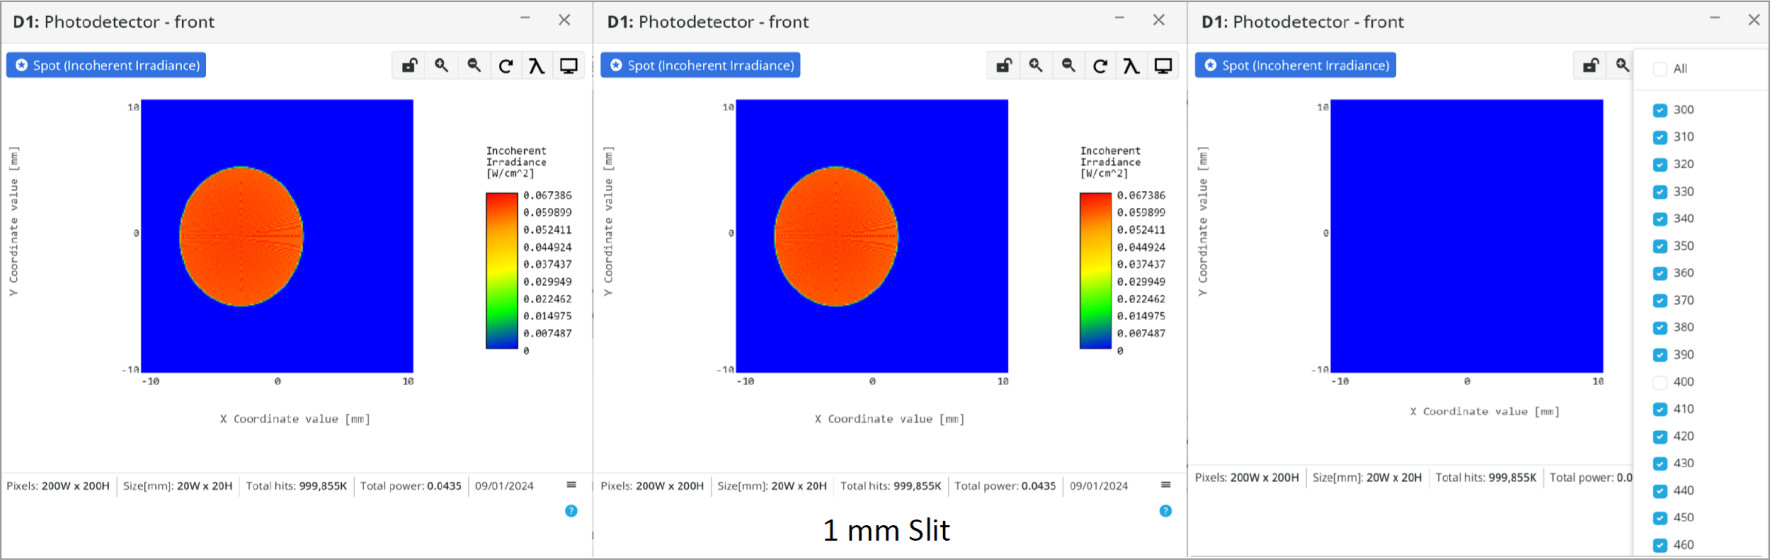
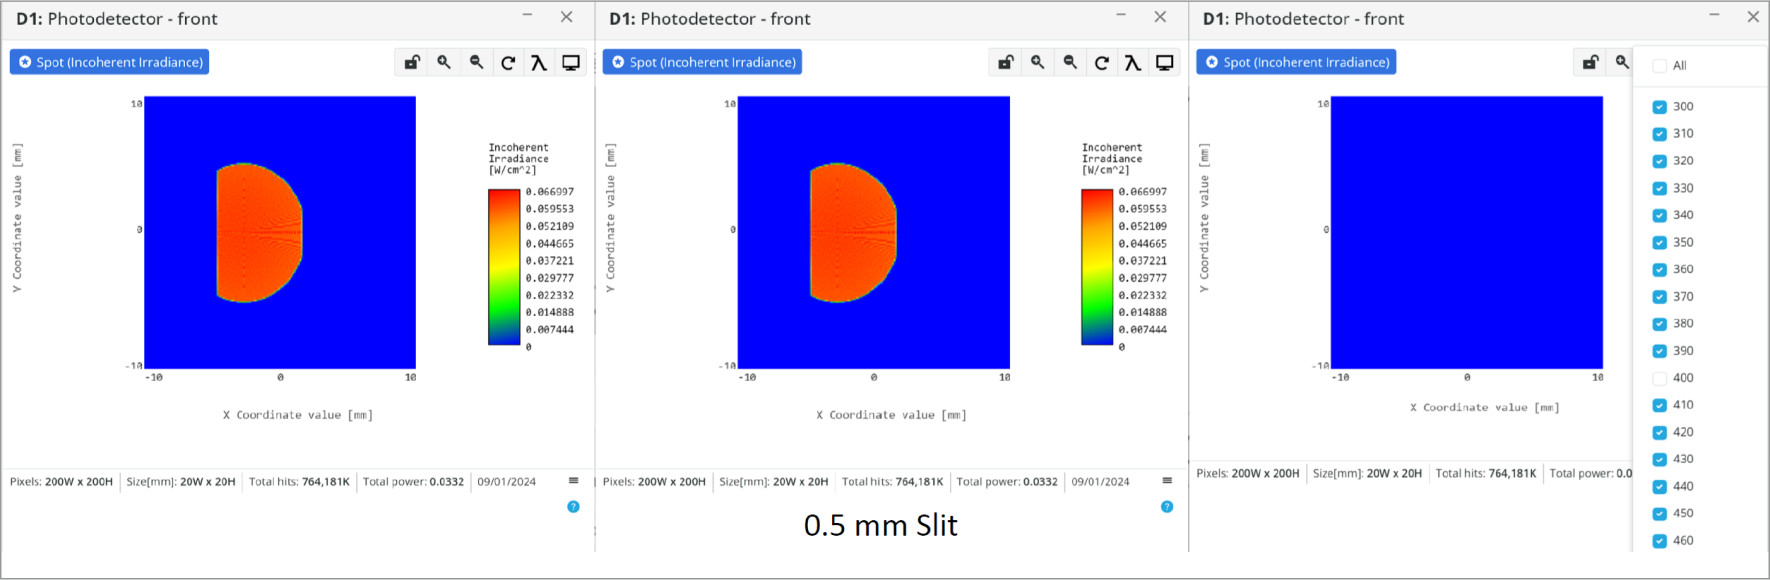
The left detector shows only the center wavelength of 400 nm. This is not obscured by the slit, so the total relative energy that makes it to the detector is 100%, but this includes power from all wavelengths.

The center detector shows all the wavelengths that make it through the slit. As additional wavelengths would be measured by the photodetector this would skew the power measurement to the high side.

The detector on the right shows the wavelengths that do not reach the detector and are completely obscured by the slit. Ideally, the slit we want to choose obscures all wavelengths except the one to measure.

Next all the slits will be analyzed to determine which will generate the best performance in the current configuration.
From the analysis, the best slit width for resolution starts at 1mm slit width allowing 0.0435 W of power on the detector at only 400 nm. However, the light source we are simulating is outputting over the wavelength range of 300-500 nm at 10 nm step sizes, so we are not seeing some of the additional wavelengths that would make it through.
At this point in the design, we would want to increase the spectral resolution of our light source by including additional wavelengths. This would allow further analysis to measure the power throughput of unwanted wavelengths and the grating range that has negligible wavelength overlap. Combined with the changing of the slit width we can further characterize the performance of our spectrometer.
The optical configuration can also be optimized as we have visually aligned the system, but made no changes once configured. The mirror focal length can be altered so that the primary wavelength that passes through the slit is focused at the slit. As can be seen in the image to the right the slit is not exactly at the focus of the mirror which will reduce the sensitivity of the system.
Spectrometers are powerful tools to use for wavelength analysis, but can have drawbacks based on the design. Knowing the tradeoffs and how to eliminate or reduce unwanted light reaching the photodetector can help increase the usability of a system.
mascot-1-1

3DOptix works
only on desktop!

Please go to 3doptix.com on a
desktop device, using the
Chrome or Edge browser

Available on January 30th, 2023